Unlocking Hidden Insights: How to Use Unsupervised Learning for Data Clustering and Pattern Discovery
In the vast ocean of data, finding meaningful connections and actionable insights can feel like searching for a needle in a haystack. This is precisely where unsupervised learning emerges as a powerful beacon, offering a revolutionary approach to data analysis. Unlike its supervised counterpart, which relies on labeled datasets, unsupervised learning delves into raw, unlabeled information to automatically discover hidden structures, intrinsic relationships, and fascinating patterns. This article will guide you through the essential techniques and practical applications of using unsupervised learning for data clustering and pattern discovery, transforming your raw data into a strategic asset. If you're looking to uncover customer segments, identify anomalies, or simply make sense of complex datasets, mastering these methods is absolutely crucial for any modern data professional.
The Core Concept of Unsupervised Learning
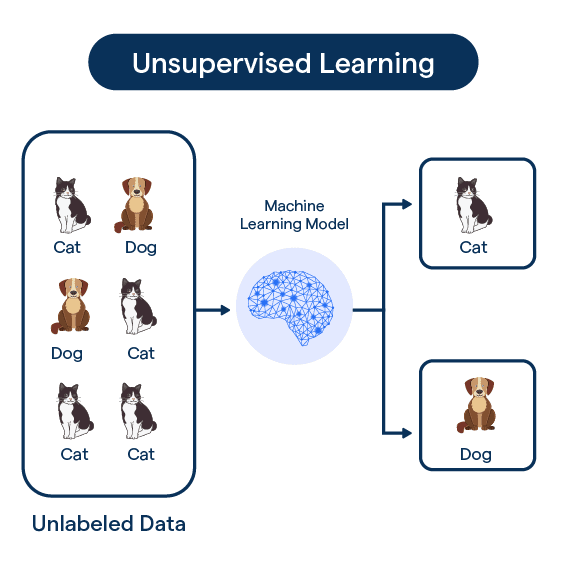
At its heart, unsupervised machine learning is about exploring data without predefined notions of what to find. Imagine you have a massive collection of customer transaction records, but no labels indicating "loyal customer" or "churn risk." Unsupervised algorithms can process this raw data and group similar customers together based on their purchasing behavior, even if you never explicitly told the system what "similar" means. This inherent ability to learn from unlabeled data makes it incredibly versatile for initial data exploration and hypothesis generation. It's the ultimate tool for uncovering the unknown unknowns within your datasets.
The primary goals of unsupervised learning typically revolve around two key areas: data clustering and dimensionality reduction (which aids in pattern discovery). Clustering involves grouping data points such that points in the same group (cluster) are more similar to each other than to those in other groups. Dimensionality reduction, on the other hand, aims to reduce the number of features in a dataset while preserving its most important information, often revealing underlying patterns that were obscured by high dimensionality.
Mastering Data Clustering: Grouping for Insights
Data clustering is perhaps the most widely recognized application of unsupervised learning. It's the process of organizing data points into groups (clusters) based on their inherent similarity. The objective is to create clusters where members are highly similar to each other, but dissimilar to members of other clusters. This technique is invaluable for data segmentation across various industries, from marketing to healthcare.
Key Applications of Data Clustering:
- Customer Segmentation: Identify distinct customer groups based on purchasing habits, demographics, or online behavior. This allows for highly targeted marketing campaigns and personalized product recommendations.
- Market Research: Discover natural groupings of products, services, or even geographical regions to understand market dynamics and identify niche opportunities.
- Anomaly Detection: Outliers, or data points that don't fit well into any cluster, can indicate fraud, system malfunctions, or unusual behavior. This is critical for security and quality control.
- Document Classification: Group similar articles, emails, or research papers together without needing pre-labeled categories, aiding in information retrieval and organization.
- Image Segmentation: Divide images into regions based on color, texture, or other visual properties, a fundamental step in computer vision.
Prominent Unsupervised Learning Algorithms for Clustering
Selecting the right algorithm is crucial for effective data clustering. Each algorithm has its strengths, weaknesses, and ideal use cases. Understanding these nuances is key to successful implementation.
K-Means Clustering: The Simplicity Powerhouse
K-Means is arguably the most popular and straightforward clustering algorithm. It aims to partition 'n' observations into 'k' clusters, where each observation belongs to the cluster with the nearest mean (centroid). The process is iterative:
- Initialization: Randomly select 'k' data points as initial centroids.
- Assignment Step: Assign each data point to the cluster whose centroid is closest, often using Euclidean distance.
- Update Step: Recalculate the centroids for each cluster based on the mean of all data points assigned to it.
- Iteration: Repeat steps 2 and 3 until the cluster assignments no longer change or a maximum number of iterations is reached.
Practical Tips for K-Means:
- Choosing Optimal K: The biggest challenge is determining the "optimal K" (number of clusters). Methods like the Elbow Method or Silhouette Score can help.
- Initialization Sensitivity: K-Means can be sensitive to the initial placement of centroids. Run the algorithm multiple times with different random initializations (e.g., using `kmeans++` in scikit-learn) to mitigate this.
- Data Scaling: K-Means is distance-based, so features should be scaled (e.g., using StandardScaler) to prevent features with larger ranges from dominating the distance calculation.
Hierarchical Clustering: Building a Tree of Relationships
Hierarchical clustering builds a hierarchy of clusters, represented as a dendrogram. There are two main types:
- Agglomerative (Bottom-Up): Starts with each data point as a single cluster and successively merges the closest pairs of clusters until all points are in one cluster, or a stopping criterion is met.
- Divisive (Top-Down): Starts with all data points in one cluster and recursively splits the most appropriate cluster until each data point is a single cluster.
The "closeness" of clusters is determined by linkage criteria (e.g., single, complete, average, or Ward's linkage). The resulting dendrogram interpretation allows for a visual representation of how clusters are nested and provides flexibility in choosing the number of clusters by cutting the tree at different heights.
Benefits: Does not require specifying the number of clusters beforehand, and provides a rich structure of relationships.
DBSCAN: Discovering Density-Based Clusters
DBSCAN (Density-Based Spatial Clustering of Applications with Noise) is excellent for discovering clusters of arbitrary shapes and identifying noise points (outliers). Instead of fixed centroids, it groups together points that are closely packed together, marking as outliers those points that lie alone in low-density regions. It defines core points, border points, and noise points based on two parameters: `epsilon` (maximum distance between two samples for one to be considered as in the neighborhood of the other) and `min_samples` (the number of samples in a neighborhood for a point to be considered as a core point).
Advantages: Can find non-spherical clusters and is robust to noise. It's particularly useful for geospatial data or identifying anomalies.
Gaussian Mixture Models (GMMs): Probabilistic Soft Assignments
Unlike K-Means, which assigns each data point to exactly one cluster, Gaussian Mixture Models (GMMs) provide a probabilistic assignment. GMMs assume that data points are generated from a mixture of several Gaussian (normal) distributions. Each data point has a probability of belonging to each cluster, allowing for overlapping clusters and more nuanced insights. The Expectation-Maximization (EM) algorithm is typically used to fit GMMs to the data.
Benefits: Provides more information than hard assignments, handles complex data distributions, and can estimate the uncertainty of assignments.
Pattern Discovery Through Dimensionality Reduction
Beyond explicit clustering, unsupervised learning also excels at pattern discovery by reducing the complexity of high-dimensional datasets. This process, known as dimensionality reduction, helps in visualization, noise reduction, and identifying the most influential features.
Principal Component Analysis (PCA): Unveiling Variance
Principal Component Analysis (PCA) is a linear dimensionality reduction technique that transforms data into a new coordinate system such that the greatest variance by any projection of the data comes to lie on the first coordinate (called the first principal component), the second greatest variance on the second coordinate, and so on. It identifies orthogonal components that capture the maximum amount of variance in the data. PCA is often used for feature engineering, data compression, and data visualization of high-dimensional datasets.
How it helps in Pattern Discovery: By reducing dimensions, PCA can reveal underlying linear relationships and clusters that might be obscured in the original high-dimensional space. The principal components themselves can sometimes be interpreted as meaningful underlying patterns.
t-SNE: Visualizing Complex High-Dimensional Data
t-Distributed Stochastic Neighbor Embedding (t-SNE) is a non-linear dimensionality reduction technique particularly well-suited for visualizing high-dimensional datasets. It maps multi-dimensional data to a lower-dimensional space (typically 2D or 3D) while preserving the local structure of the data. This means that points that are close together in the high-dimensional space remain close together in the lower-dimensional map.
How it helps in Pattern Discovery: t-SNE is incredibly effective at revealing clusters and complex non-linear structures that PCA might miss. It's a go-to tool for visualizing complex datasets like genomics data, image features, or text embeddings, helping researchers and analysts visually identify distinct groups or gradients in their data.
Practical Steps for Implementing Unsupervised Learning
Implementing unsupervised learning effectively requires a systematic approach. Here's a general workflow:
- Define Your Objective: What specific insights are you hoping to gain? Are you looking for customer segments, anomalies, or simply to understand data structure? A clear objective guides your choice of algorithm and evaluation.
- Data Preprocessing: This is a critical step.
- Handling Missing Values: Impute or remove.
- Feature Scaling: Most unsupervised algorithms (especially distance-based ones like K-Means) are sensitive to feature scales. Normalize or standardize your data.
- Outlier Treatment: Decide whether to remove or account for outliers, as they can heavily influence clustering results.
- Algorithm Selection: Based on your objective and data characteristics (e.g., number of data points, dimensionality, expected cluster shapes), choose an appropriate algorithm. Consider starting with simpler methods like K-Means and moving to more complex ones like DBSCAN or GMMs if needed.
- Parameter Tuning: Unsupervised algorithms often have parameters (e.g., 'k' for K-Means, 'epsilon' and 'min_samples' for DBSCAN). Experiment with different parameter values to find the best fit for your data.
- Evaluation and Interpretation: Unlike supervised learning, there are no "ground truth" labels for direct accuracy measurement.
- Internal Evaluation Metrics: Use metrics like the Silhouette Score, Davies-Bouldin Index, or Calinski-Harabasz Index to assess cluster quality based on compactness and separation.
- Domain Expertise: The most crucial evaluation comes from domain experts. Do the discovered clusters or patterns make sense in the real world? Are they actionable?
- Visualization: Plotting the clusters (e.g., using PCA or t-SNE for dimensionality reduction) can provide intuitive insights and help assess results.
- Actionable Insights & Deployment: Once validated, translate the discovered patterns into actionable strategies. For example, use customer segments to tailor marketing messages or integrate anomaly detection into a fraud prevention system.
Actionable Tips for Success with Unsupervised Learning
To truly leverage the power of unsupervised learning for data clustering and pattern discovery, keep these expert tips in mind:
- Start Simple, Then Iterate: Don't jump straight to the most complex algorithm. Begin with simpler methods like K-Means and gradually explore more sophisticated options if your initial results aren't satisfactory.
- Embrace Visualization: Always visualize your data before and after applying unsupervised techniques. Tools like scatter plots, heatmaps, and dimensionality reduction plots (PCA, t-SNE) are indispensable for understanding your data's structure and validating your findings.
- Combine with Domain Knowledge: The most meaningful insights often emerge when algorithmic discoveries are validated and enriched by deep domain expertise. Collaborate with subject matter experts to interpret patterns and ensure their practical relevance.
- Iterate on Preprocessing: Data cleaning and transformation are not one-time steps. Different scaling methods or feature engineering techniques can significantly impact clustering results. Be prepared to experiment.
- Don't Overlook Anomaly Detection: While clustering aims to group similar items, the "leftovers" or outliers can be incredibly valuable. Dedicated anomaly detection algorithms (like Isolation Forest or One-Class SVM) can complement clustering efforts to find unusual patterns.
- Consider Ensemble Approaches: Sometimes, combining the results of multiple clustering algorithms or different initializations can lead to more robust and stable clusters.
Common Challenges and How to Overcome Them
While powerful, unsupervised learning isn't without its challenges. Being aware of these can help you navigate your projects more effectively:
- Determining the Optimal Number of Clusters (K): For algorithms like K-Means, choosing 'k' is often subjective. Utilize statistical methods (Elbow Method, Silhouette Score) and, more importantly, domain knowledge to guide your decision. Sometimes, business requirements dictate the number of segments needed.
- Scalability Issues: Some algorithms, especially hierarchical clustering, can become computationally expensive with very large datasets. Consider sampling, using distributed computing frameworks, or opting for more scalable algorithms (e.g., MiniBatch K-Means).
- Interpreting Complex Patterns: Unsupervised learning often reveals patterns that are not immediately intuitive. This is where the combination of data visualization, statistical analysis, and domain expertise becomes crucial. Can you put a human-readable label on each cluster?
- Sensitivity to Noise and Outliers: Many clustering algorithms are sensitive to noisy data and outliers, which can distort cluster centroids or boundaries. Robust preprocessing and the use of algorithms designed for noise (like DBSCAN) are vital.
- Curse of Dimensionality: In very high-dimensional spaces, data points become sparse, and distances between them become less meaningful, making clustering difficult. Dimensionality reduction techniques like PCA or feature selection are essential countermeasures.
By understanding these challenges and applying the suggested solutions, you can significantly improve the quality and actionability of your unsupervised learning projects. The journey of pattern recognition through unsupervised methods is an iterative one, constantly refined by experimentation and expert validation.
Frequently Asked Questions
What is the primary difference between supervised and unsupervised learning?
The fundamental distinction lies in the type of data used for training. Supervised learning relies on labeled data, meaning each input example is paired with a corresponding output or "correct answer." For instance, an algorithm trained to classify emails as spam or not spam uses a dataset where emails are already marked as such. In contrast, unsupervised learning operates on unlabeled data. Its goal is to discover hidden structures, relationships, and patterns within the data on its own, without any prior knowledge of outputs. This makes it ideal for tasks like data clustering, where you want to group similar items without knowing the group definitions beforehand, or for dimensionality reduction to simplify complex datasets.
How do I choose the right unsupervised learning algorithm for my data clustering task?
Choosing the correct unsupervised learning algorithm for your data clustering task depends on several factors:
- Data Characteristics: Is your data spherical or irregular in shape? Do you expect clear, distinct clusters or overlapping ones?
- Dataset Size: K-Means is generally faster and more scalable for large datasets, while hierarchical clustering can become computationally intensive.
- Presence of Noise/Outliers: If your data contains significant noise or outliers, algorithms like DBSCAN are more robust as they can explicitly identify and ignore these points.
- Expected Cluster Shapes: K-Means is best for spherical, equally sized clusters. DBSCAN can find arbitrary shapes. GMMs are suitable for elliptical clusters and provide probabilistic assignments.
- Need for Number of Clusters (K): If you know or can reasonably estimate 'K' beforehand, K-Means is a good choice. If you prefer to explore a hierarchy of clusters without pre-specifying 'K', hierarchical clustering is better.
Can unsupervised learning be used for anomaly detection, and how?
Absolutely, unsupervised learning is exceptionally well-suited for anomaly detection. The core idea is that anomalies are data points that deviate significantly from the "normal" patterns or groups found in the majority of the data. Clustering algorithms, such as K-Means or DBSCAN, can identify anomalies by:
- Distance from Centroid (K-Means): Data points that are very far from any cluster's centroid can be flagged as anomalies.
- Noise Points (DBSCAN): DBSCAN explicitly identifies "noise points" that do not belong to any dense cluster, making it naturally effective for anomaly detection.
- Low Density Regions: Algorithms can identify regions of low data density, and points residing in these sparse areas are considered anomalous.
Ready to transform your raw data into powerful insights? Explore our comprehensive resources on data science fundamentals and discover how these techniques can revolutionize your approach to business intelligence. For deeper dives into specific algorithms or custom solutions, feel free to contact our expert team.
0 Komentar